SQL Server
This workflow provides a read-only SQL interface to an ApertureDB instance via PostgreSQL. It enables integration with SQL-based tools and dashboards, and includes a lightweight HTTP API for issuing SQL queries programmatically.
Creating the workflow
![[object Object]](/assets/images/configure_sql_server-47a8c80792c8b04470d9bbd2078b1bc6.png)
- This workflow requires no configuration. Simply click the blue button at the bottom.
When the SQL server workflow starts up, it will read the schema for your ApertureDB instance and define corresponding tables. For this reason, you should ensure your ApertureDB instance is populated with data before running the SQL workflow. If you change your ApertureDB schema, for example by ingesting a new type of object, it will be necessary for you to restart the workflow in order to access any new tables and columns.
See the results
Jupyter Notebook
If you are running the Jupyter Notebook workflow, then there is a notebook sql.ipynb that gives a quick demonstration of using SQL queries with ApertureDB.
The notebook covers using SQL to do graph queries, object retrieval, image manipulation, and vector (similarity) search.
It also shows you how to use EXPLAIN to reveal the underlying ApertureDB queries.
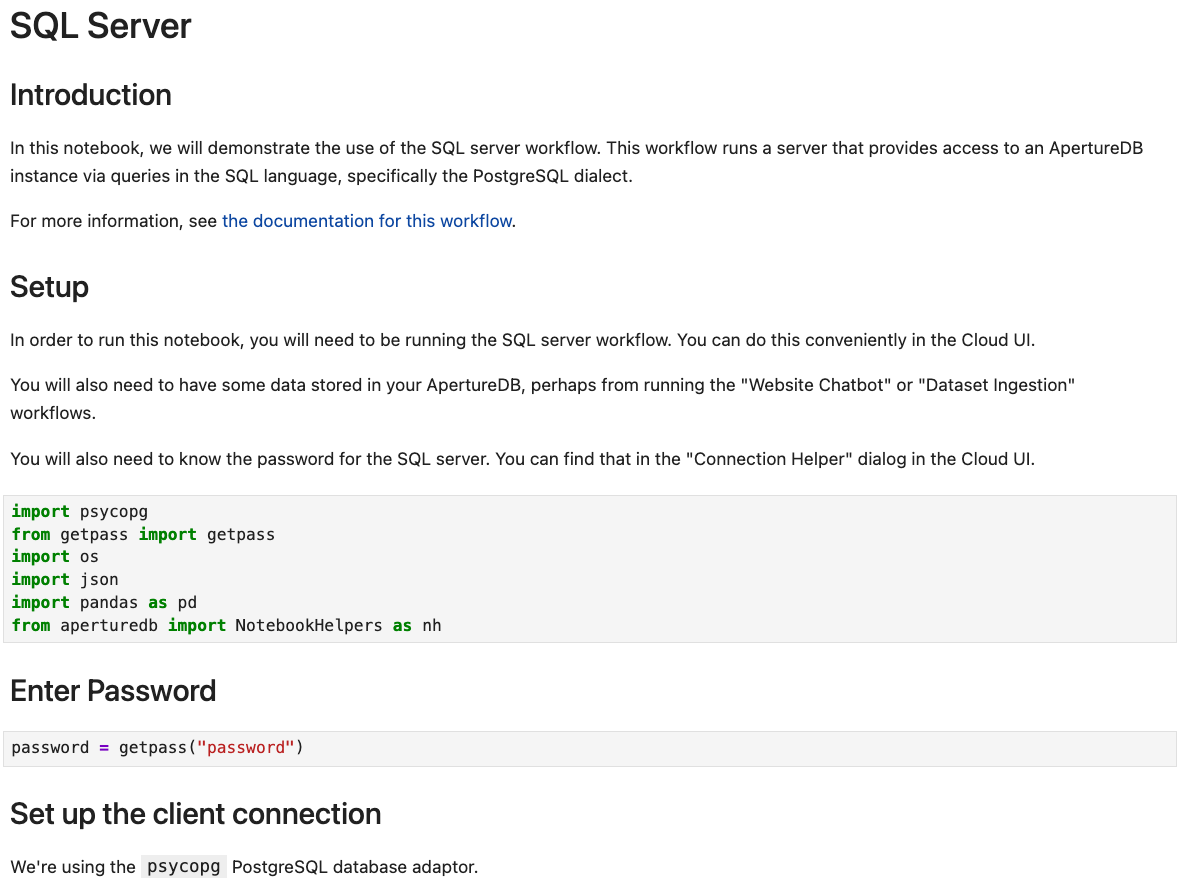
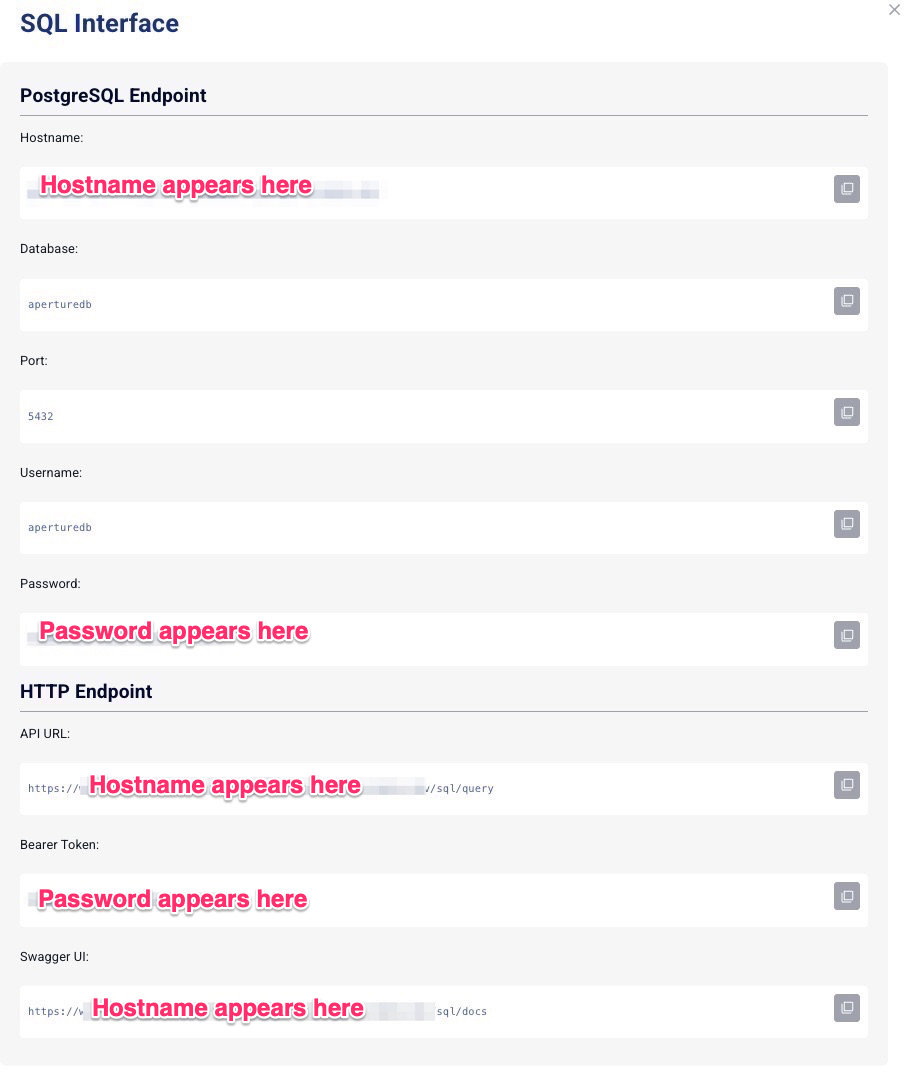
Before starting the notebook, use the Connection Helper in the Workflows tab of the ApertureDB Cloud UI to find the PostgreSQL password.
HTTP API
The service provides a simple HTTP API for asking SQL queries. For testing convenience, this API can be accessed via the built-in Swagger UI. Find the Swagger UI link in the Connection Helper in the Workflows tab of the ApertureDB Cloud UI.
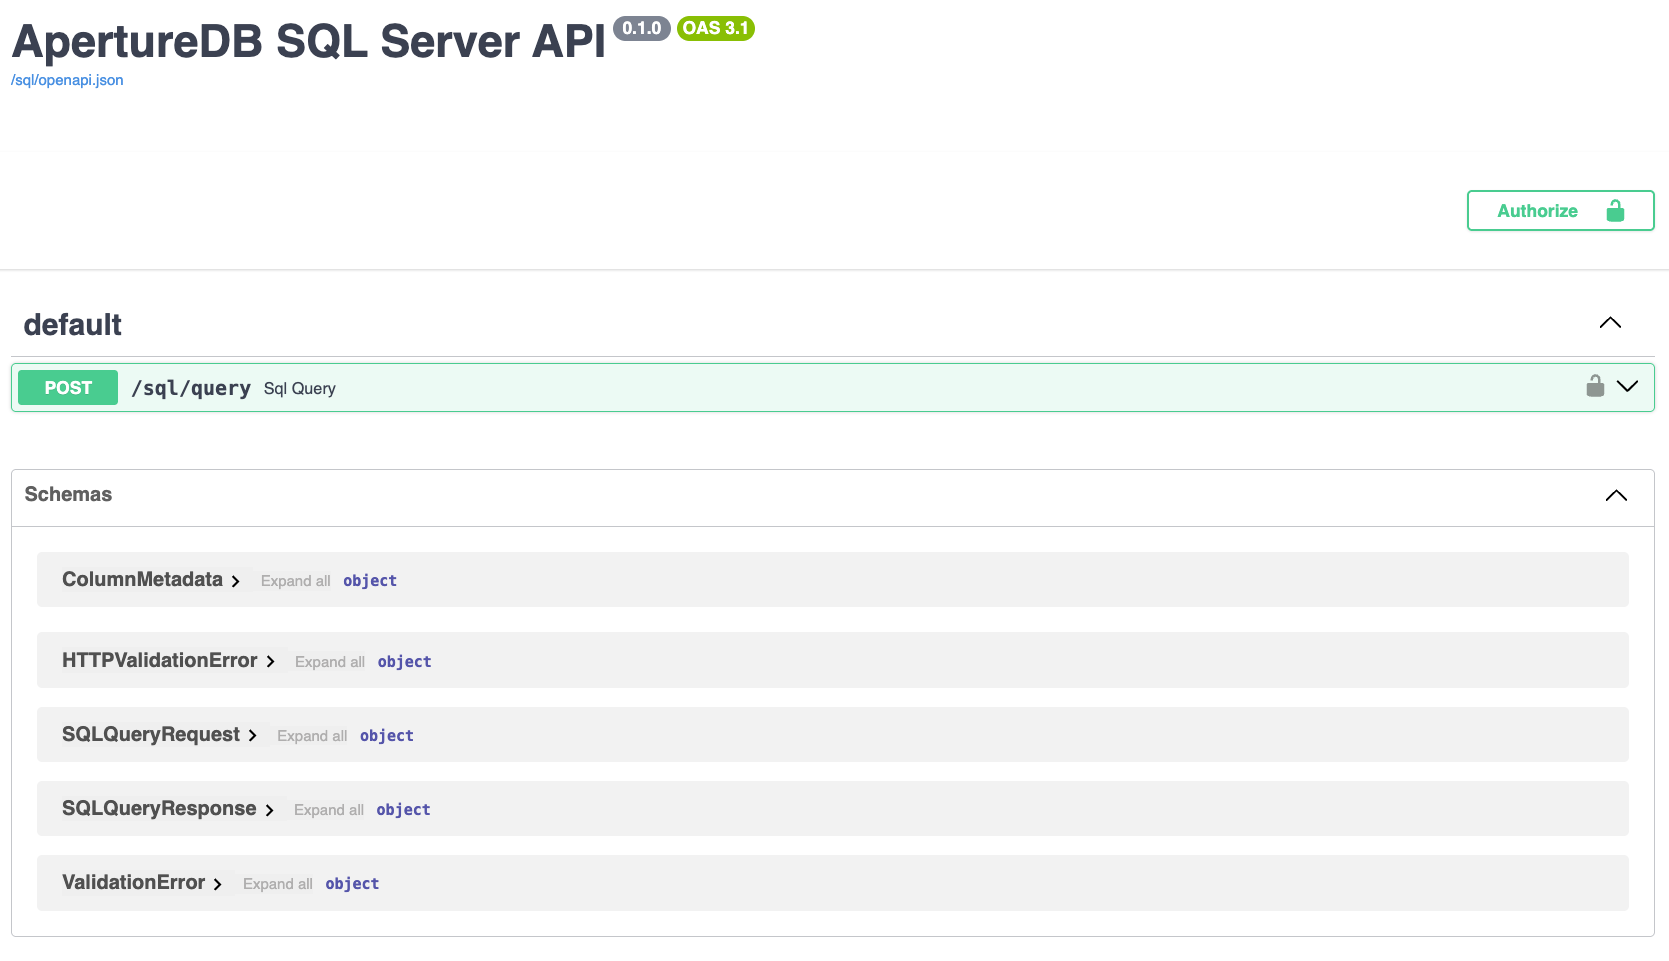
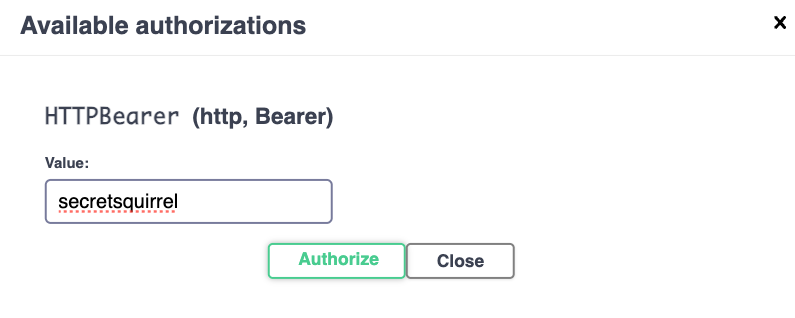
As before, you will also need the password. Enter it by clicking on the "Authorize" button at the top right.
Open up the entry for /sql/query and click "Try It".
Enter a query in the "Request body" and hit Execute.
{
  "query": "SELECT * FROM \"Entity\" LIMIT 5;"
}
Remember that you will usually need to double-quote table names, and that double-quotes must be escaped within a JSON string.
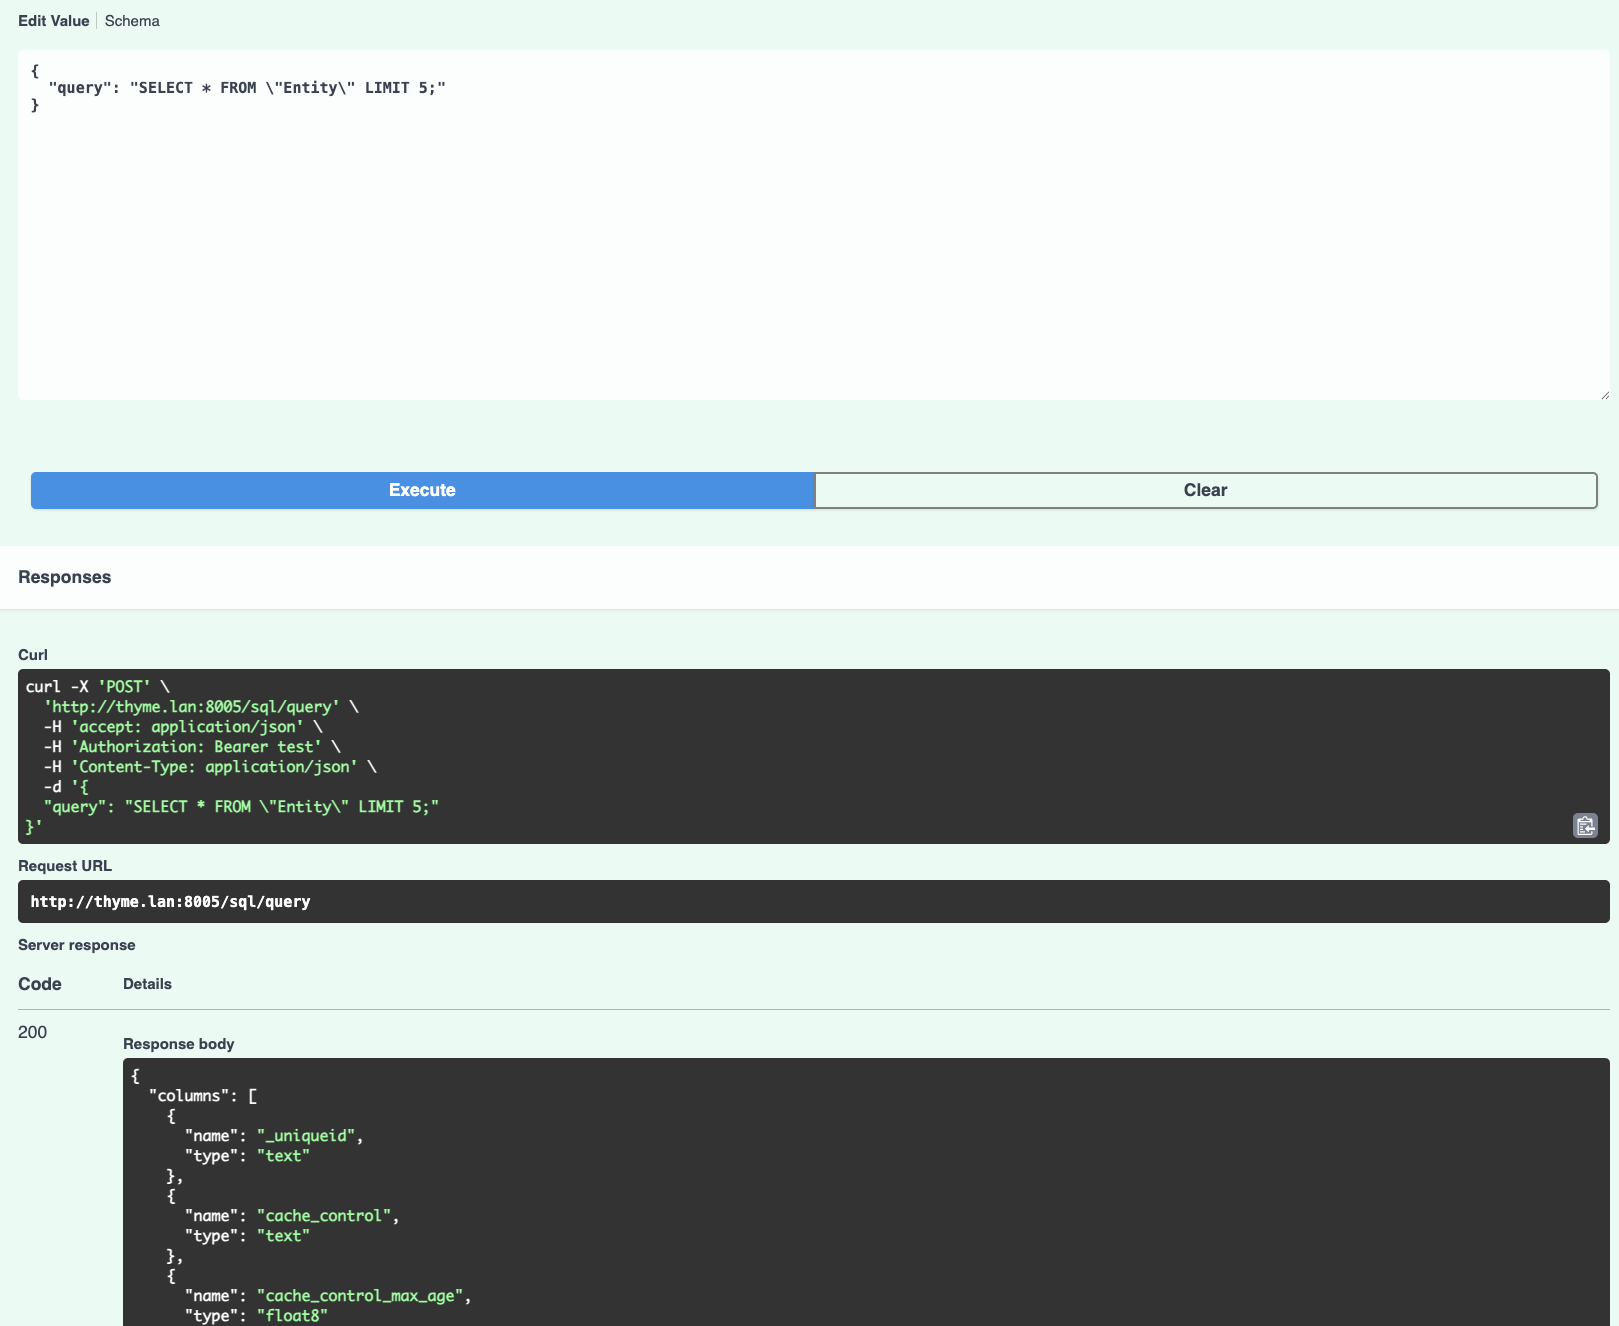
Hit "Execute" and you will see the results displayed under "Response body".
pgAdmin
pgAdmin is a free tool for accessing PostgreSQL databases. To access the SQL Server workflow from pgAdmin, first get the hostname and password from the Connection Helper in the Workflows tab of the ApertureDB Cloud UI.
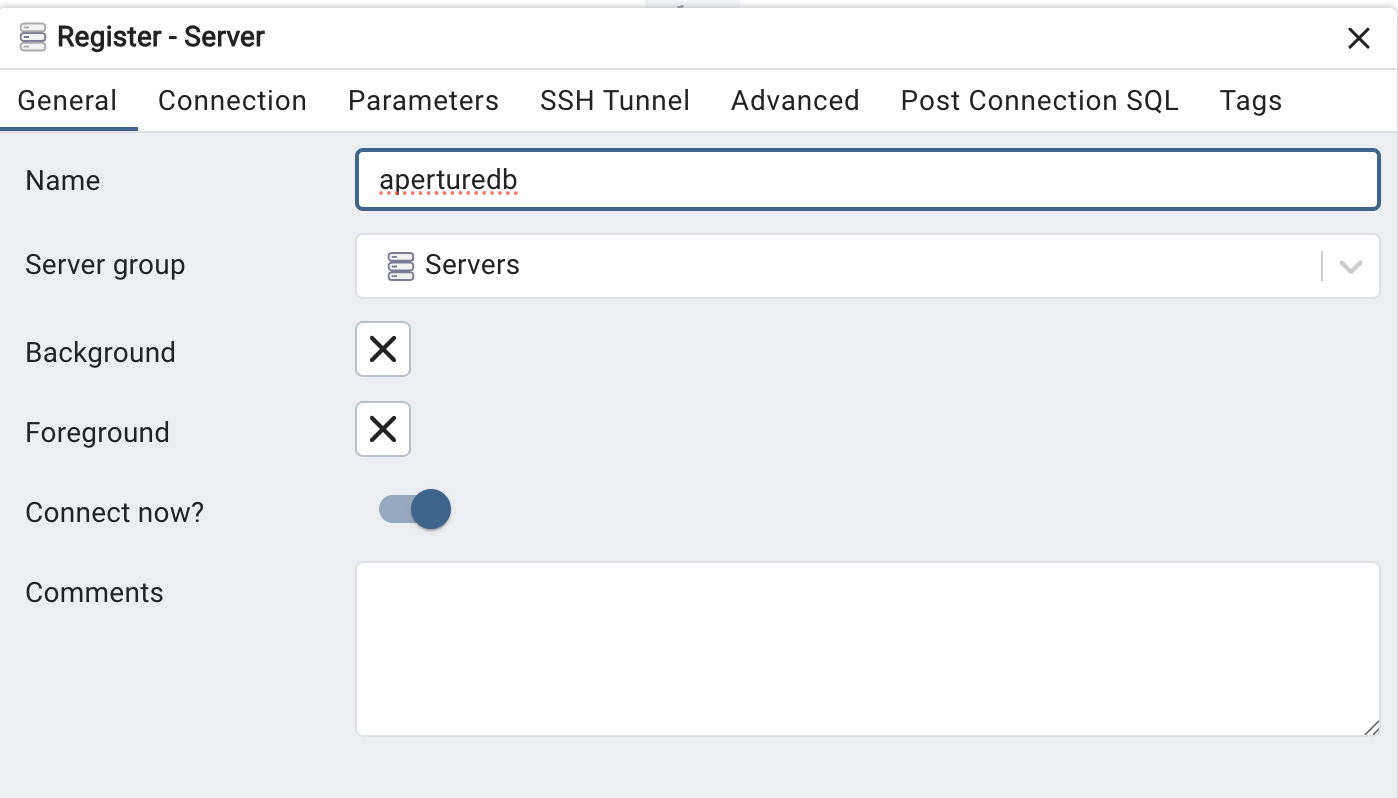
- In pgAdmin, select Register / Server.
- On the "General" tab, enter a name for this server, like "aperturedb".
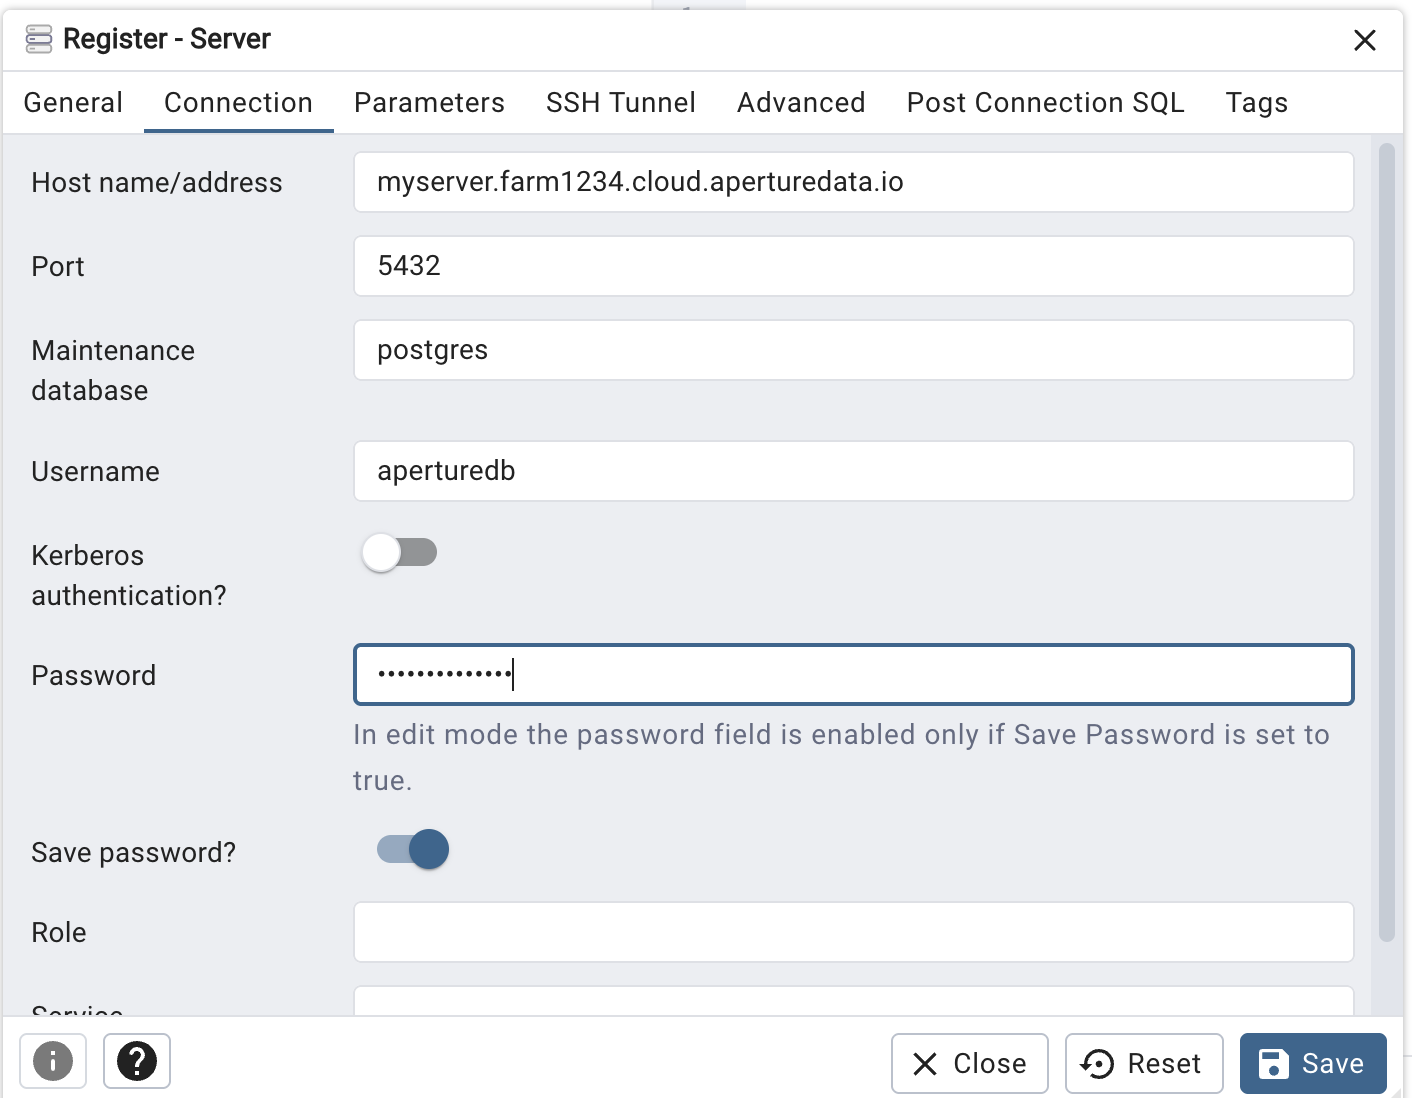
- On the "Connection" tab, enter:
- the hostname from Connection Helper
- the username "aperturedb"
- the password from Connection Helper (You probably also want to select the option to "Save Password".)
- Finally, hit "Save".
psql CLI
There is also a command-line interface available for PostgreSQL called psql.
We can't cover all the details of installing PostgreSQL client libraries here, but on Linux systems you may be able to install psql with:
sudo apt install postgresql-client-common postgresql-client
You can then type psql -h <hostname> -U aperturedb and enter your password.
As before, see the Connection Helper in the Workflows tab of the ApertureDB Cloud UI to find the hostname and password.
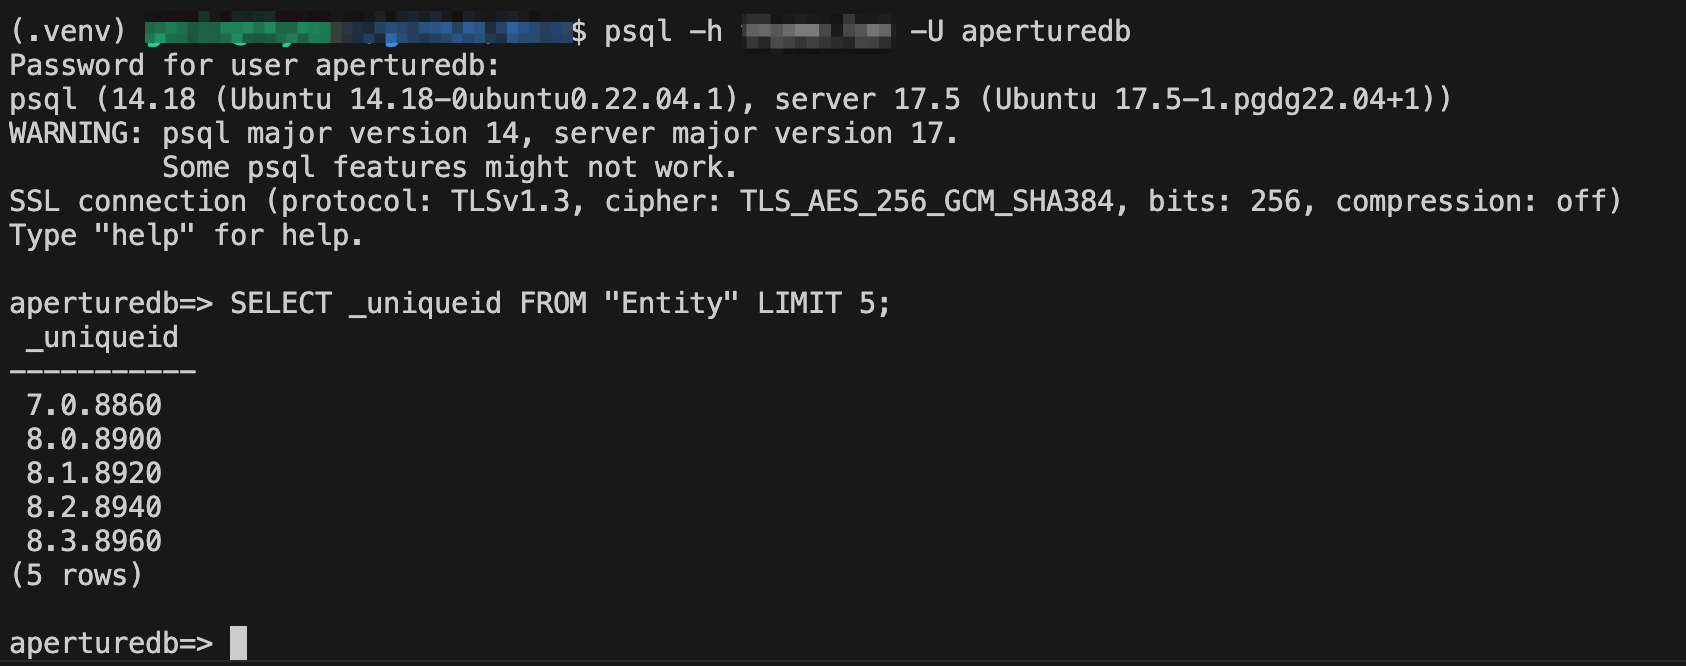
Now you can enter SQL queries and use other features. For example, enter "\d" to see a list of all tables.
Grafana
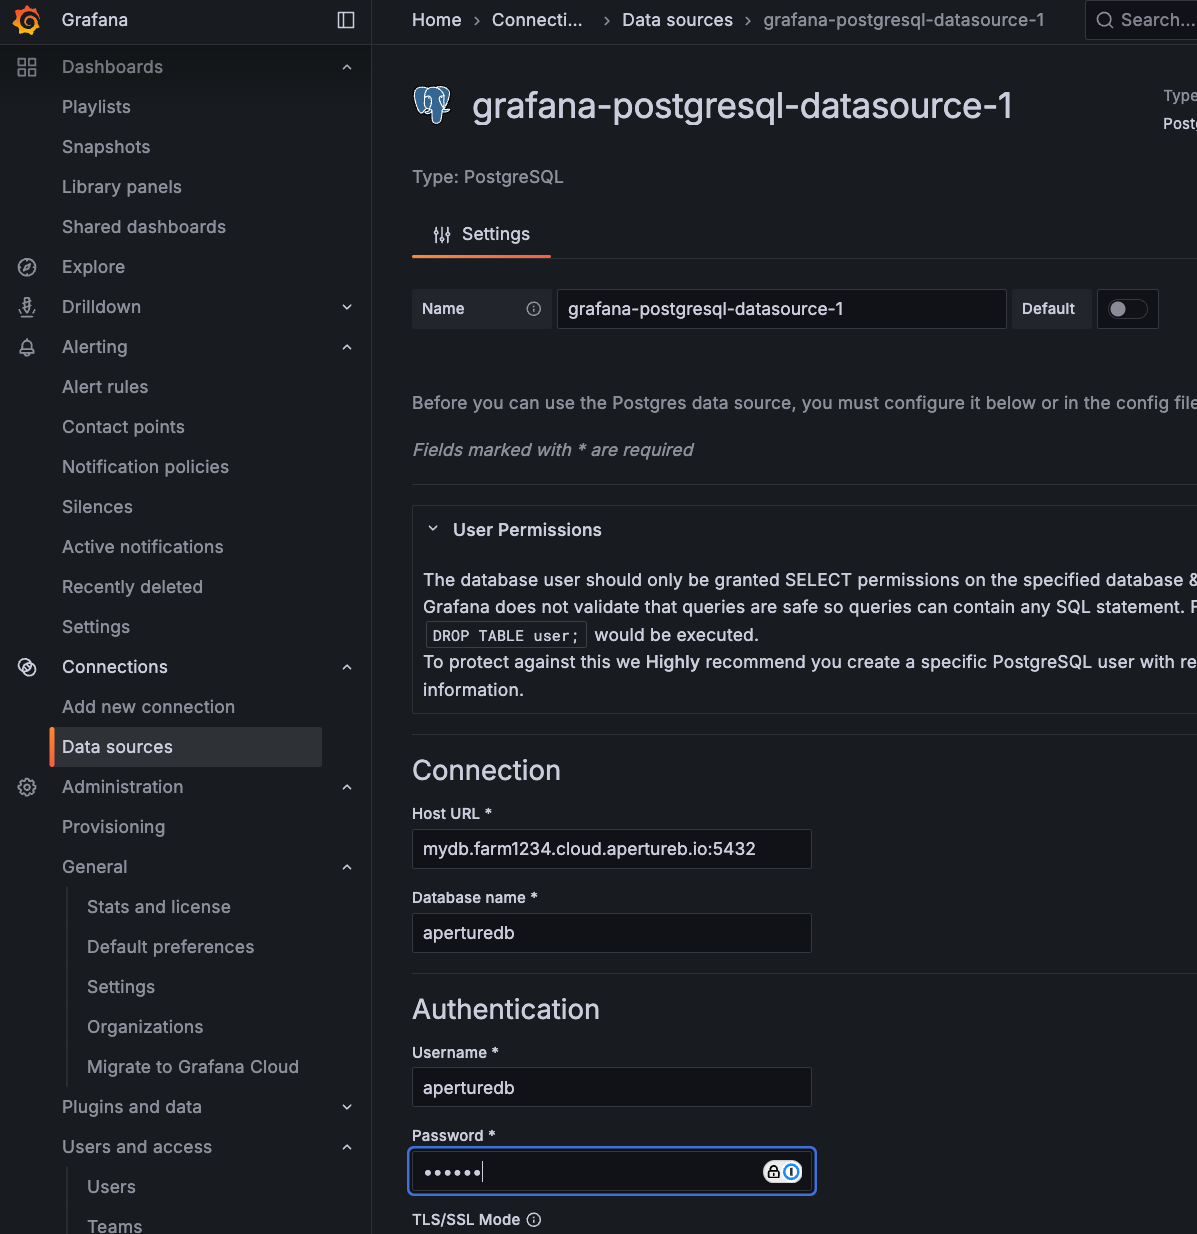
With this workflow, it is easy to connect ApertureDB to any software that has a PostgresSQL integration. This includes dashboards like Grafana.
- Select "Data sources" from the menu on the left.
- Click "Add new data source"
- Choose PostgreSQL from the list.
- For "Host URL", use the hostname from the Connection Helper in the ApertureDB Cloud UI.
- For "Database name", enter
aperturedb. - For "username", enter
aperturedb. - For "Password", enter the password from the Connection Helper in the ApertureDB Cloud UI.
- Click the "Save & test" button at the bottom.
You can now use this source in your Grafana visualizations.