Query and Visualize
ApertureDB Web UI
After ingesting some data, you can see it's status on the ApertureDB Web UI.
You can also filter data based on attribute values and see the matching images or videos from the same UI dashboard. The generated JSON-based query can be seen in the pane below the images or videos.
If images have associated bounding boxes, they are shown on the UI as seen in the snapshot below. You can do minor edits to these bounding boxes such as changing their labels or coordinates.
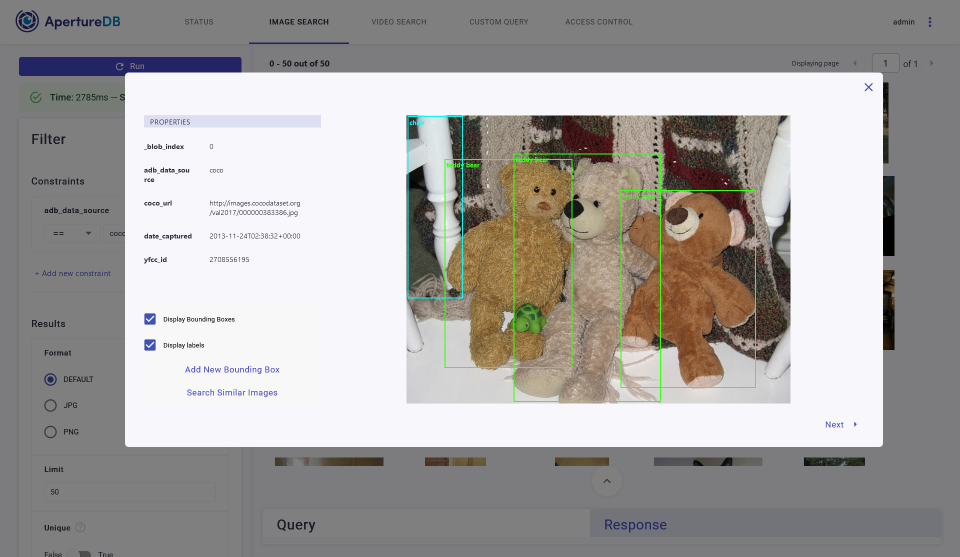
Our UI now also supports the option to see similar images in case embeddings corresponding to the displayed images are available in the database.
The Custom Query tab is a great place to start customizing queries and trying them out. We offer an autocomplete feature to help with the syntax and options.
Overall, it's a handy interface to examine datasets, let's say prior to training or inference as well as after if any debugging or understanding is required without writing a lot of code.
Various ApertureDB Query Alternatives
In addition to graphically querying data on the web frontend, you can query data managed by ApertureDB in the following ways:
- Query using JSON commands from Python in Jupyter notebooks / custom query tab in UI or from C++ applications
- Query using the Python SDK object wrapper API
- Query using the REST API from any client (we provide Python wrappers) to send JSON-based queries
Head over to our simple and advanced usage tutorials with real application examples. Some of those examples are preloaded into our online trials.
You can also query and feed data into or retrieve it from the various tools and frameworks that we have integrations for.